Myth #6: The Grid Plan Caused Too Much Density and Rampant Land Speculation
By Jason M. Barr with Gerard Koeppel
In the two centuries since its creation, the grid plan has had no shortage of critics. Many, for example, have bemoaned its relentless monotony, its disregard for Manhattan’s topography and its lack of grand boulevards. In many respects, the grid has become a kind of Rorschach blot for the failures of 19th century New York to provide a cleaner, more efficient, and greener city. Detractors often see the plan as the cause or catalyst of the larger problems that New York confronted from rapid economic growth, massive immigration and poverty, and a municipal government that was, more or less, unable and unwilling to effectively handle these issues.
The Grid Plan and Population Density
One strain of thought has to do with the size of the blocks and lots. As discussed in a previous post, architect Ernest Flagg, writing in 1894, has helped to fuel the (false) impression that the ubiquitous 25 x 100 square foot lot was a result of the grid plan, which, he argued, promoted over-crowding in the tenements.
Fredrick Law Olmstead, co-designer of Central Park, was also a fierce critic of the plan. In 1876, along with John James Robertson Croes, he lodged a complaint similar to that of Flagg’s:
[S]ome two thousand blocks were provided, each theoretically 200 feet wide, no more, no less…. Decent, wholesome, tidy dwellings for people who are struggling to maintain an honorable independence are more to be desired in a city than great churches, convents or colleges. They are sadly wanting in New York, and why?….The rigid uniformity of the system of 1807 requires that no building lot shall be more than 100 feet in depth, none less. The clerk or mechanic and his young family, wishing to live modestly in a house by themselves, without servants, is provided for in this respect no otherwise than the wealthy merchant….
The implication was that, for the immigrant poor, the alleged hyper-rigidity of the blocks created overcrowded and unsanitary conditions, in part, because the grid incentivized landlords to maximize building density, while skimping on amenities. An observer walking through the city might confuse the small lots and long but narrow blocks as also being the source of Manhattan’s excessive population density (see figure below). Late-18th century New York contained the most crowded neighborhoods of any city (see table below). But this begs the question of whether the grid plan itself was somehow contributing to excessive population density.

3D image of Manhattan’s relative population density. Figure created by Jason Barr from tables in volume II of The First Report of the Tenement House Department of the City of New York (1903). Each bar is the population per acre for each block (lower and upper Manhattan excluded). Red bars are over 1000 people per acre.

Population density (per acre) of selected cities and neighborhoods in the late-19th century. Note neighborhood names come directly from the source. Report of the Tenement House Committee (1895). *Manhattan only. **Sanitation District A, within the 11th Ward.
To investigate this question, a statistical analysis was performed of the population density of each block in 1900 Manhattan. The idea was to compare block-level density in the “old” city below the grid plan demarcation line to that of the “new” city above the line which ran roughly from East Houston Street and then across to what is today’s West 3rd Street and then just north of Greenwich Village (see below), while controlling for other factors that would have likely influenced this density across the island.

Grid plan of 1811. Red section is old city established before the grid plan.
Samuel J. Willis and D. T. Valentine, Manual of the Corporation of City of New York for 1853 (1852).
The results give support to the idea that the grid plan, in fact, helped reduced density. South of the demarcation line, density was about 30% higher than north of it, controlling for many of the other variables that influenced block-level population density. Further, the results also showed that the larger blocks in the plan were associated with less density. If two blocks, for example, were the same in every respect, except one was an acre larger, it was likely to have 14% fewer people per acre, on average. So, in a way, the grid plan seems to have helped reduce the problem of overcrowding, relative to the old city.
More broadly, the real problem of hyper-density was due to the fact that Manhattan is a long, narrow island and the immigrant enclaves tended to cluster just north of downtown, the heart of New York’s economy. As millions of poor Europeans flooded into the city, they saw the ethnic enclaves as their places of refuge. It was the island itself, not the grid plan, that hemmed them in.

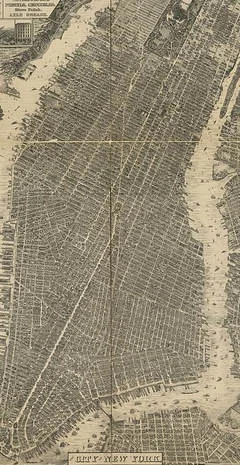
This map shows Manhattan’s population density in 1865. The black circle has a one-mile radius centered at City Hall. Because of lower Manhattan’s peninsula-like nature, it restricted the amount of land for businesses and residences. As a result, the dense immigrant enclaves were even more compact than would have been the case otherwise. Map by Jason Barr from data input by Carlos Villarreal. Underlying density data is from volume II of the Annual Report of the Metropolitan Board of Health (1868).
The Grid Plan and Land Speculation
As discussed in an earlier post, in 1808, John Randel Jr. was given his charge as chief surveyor for the Commissioners. Taking his job seriously, he traipsed through the forests and farms to map mostly-rural Manhattan into a future city; property owners were not happy. They saw Randel as a trespasser and harbinger of urbanizing doom; he was repeatedly threatened and sometimes arrested in the effort to thwart him.
About a half century later, Randel had the opportunity to reflect that, “This Plan of the Commissioners, thus objected to before its completion, is now the pride and boast of the city; and the facilities afforded by it for buying, selling and improving real estate… must have greatly enhanced [its] value.” And of those locals who harassed him in his surveying efforts, many of their descendants “have been made rich thereby.”
Yet some have complained that the plan was “too successful” — that by standardizing the land it allowed for rampant speculation. A typical critique is given by urban historian John Reps, who writes, “As an aid to speculation the commissioners’ plan was perhaps unequaled, but only on this ground can it be justifiably called a great achievement.”
But the belief that the grid plan created a speculative frenzy is a bit like blaming the automobile for traffic congestion. The plan was the means by which people could develop the land; the mapping of Manhattan, as an objective of economic and social needs, was not the cause of the rampant land trading. Platting schemes, in the U.S., no matter their form, frequently were followed by a speculative bubble because of the excitement they engendered, offering hopeful pathways to the future.
Speculative bubbles were not unique to New York. In the 1830s, Chicago’s land values soared after the land was platted and plans for a canal to link Lake Michigan with the Mississippi River were established. A land boom occurred in Florida in the 1920s sparked by the rising interest in developing the state for tourism and vacation homes.
Reviewing the long sweep of real estate booms and busts in America’s history has lead economist Edward Glaeser to conclude:
The first and most obvious lesson of this history is that America has always been a nation of real estate speculators. Real estate speculation was an integral part of the “winning of the west,” the construction of our cities, and the transformation of American home life, from tenements to mini-mansions.
The point is that there was nothing so unique about Manhattan’s grid scheme that caused people to behave differently compared to other platting plans. That fact that it drove people to bid up land prices more than they might be worth is an issue of human psychology, not of maps reposing in municipal offices.
Jason M. Barr is a Professor of Economics at Rutgers University-Newark, and the author most recently of Building the Skyline: The Birth and Growth of Manhattan’s Skyscrapers. Gerard Koeppel is the author of City on a Grid: How New York Became New York, Water for Gotham: A History, and Bond of Union: Building the Erie Canal and the American Empire.